
Introduction
Persistent unfounded claims of widespread “election fraud” following the November 2020 presidential election have significantly damaged many American’s trust in their democracy. Polls have found that fewer than 40% of Republicans believe the most recent election was free and fair. As the largest video platform, YouTube has played a significant role in the spread of this misinformation.
As part of a prior study for Transparency Tube, we analyzed how the “election fraud” narrative was covered on YouTube during the week following the election. In this report, we share results from extending our analysis to cover the period between November 3, 2020 and January 31, 2021.
High-level takeaways:
- Between Nov 3, 2020 and Jan 31, 2021, over 2,200 of the largest English language political and cultural channels on YouTube uploaded over 30,000 videos combined that discussed “election fraud.” These videos generated a total of 2.4B views.
- We estimate that nearly 14,000 of these videos, which accounted for 820M views, supported former President Trump’s claim of widespread “voter fraud.”
- Dominion Voting Systems and Smartmatic were each mentioned in a large number of videos discussing “election fraud.” Dominion was mentioned in 6,813 videos that generated 582M total views and Smartmatic was mentioned in 1,493 videos that generated 153M total views.
- We collected information on 854 videos discussing “election fraud” that were removed by YouTube for reasons related to their content. These generated at least 52M views, and we estimate they received 92% of the views they would have if left on the platform.
- Even after YouTube updated its terms of service on Dec 9th, a significant number of videos were uploaded that violated it, yet were not taken down. Between Dec 9 and Jan 31, we estimate that 3,800 videos that support claims of widespread “voter fraud” were uploaded and these accounted for 180M views.
- At the bottom of this report, we provide an interactive interface to explore videos discussing election fraud, including the ability to jump to specific spots in the video where the topic is discussed, filter videos by channels, category, removal type, etc.
Note: We are not claiming that more moderation is the solution to this type of misinformation (in many cases we believe effective counter messaging is a better option). However, we believe it’s important to measure how effectively YouTube enforces their terms of service and the scale of “election fraud” misinformation on their platform given their lack of transparency on these topics.
Narrative definition
We define the “election fraud” narrative in a very similar way to this portion of YouTube’s updated terms of service: “Content that advances false claims that widespread fraud, errors, or glitches changed the outcome of any past U.S. presidential election.”
The two differences are that:
- We only focus on the 2020 presidential election.
- YouTube hasn’t clearly defined “advances false claims,” so we must use our own definition. We determine that any clip in which the content creator is making statements clearly aimed at increasing the viewers chances of believing such false claims are included.
Videos are either labeled as “supporting” the narrative, “disputing” the narrative, or “other” if they are not related to the narrative, but discuss “election fraud.” Further details are provided here.
Analysis overview
This analysis is made possible by Pendulum’s unique access to data on over 7,300 of the largest English language YouTube channels that discuss political and cultural issues (all with over 10K subscribers). This includes data on over 9.4M videos, nearly 300K of which have been removed since September 2020.
We use a variety of keyword pairs which we’ve determined accurately capture discussions of “election fraud” in video transcripts. For 795 of the videos identified this way we manually review the video to determine whether it “supports” or “disputes” the narrative of “election fraud”. For the remaining 29,000 videos, information on political orientation of the publishing channel, as well as a few other characteristics, are used to predict the videos’ stance on the narrative.
A thorough explanation of our methodology can be found here. We find our heuristic to be quite accurate for videos uploaded prior to the TOS change (for “support” it has a precision of 0.84 and recall of 0.96) and sufficiently accurate for those uploaded after the TOS change (for “support” the precision drops to 0.68 and the recall is 0.97). In both cases, our overall estimates for views and videos account for differences in false positive and false negative rates.
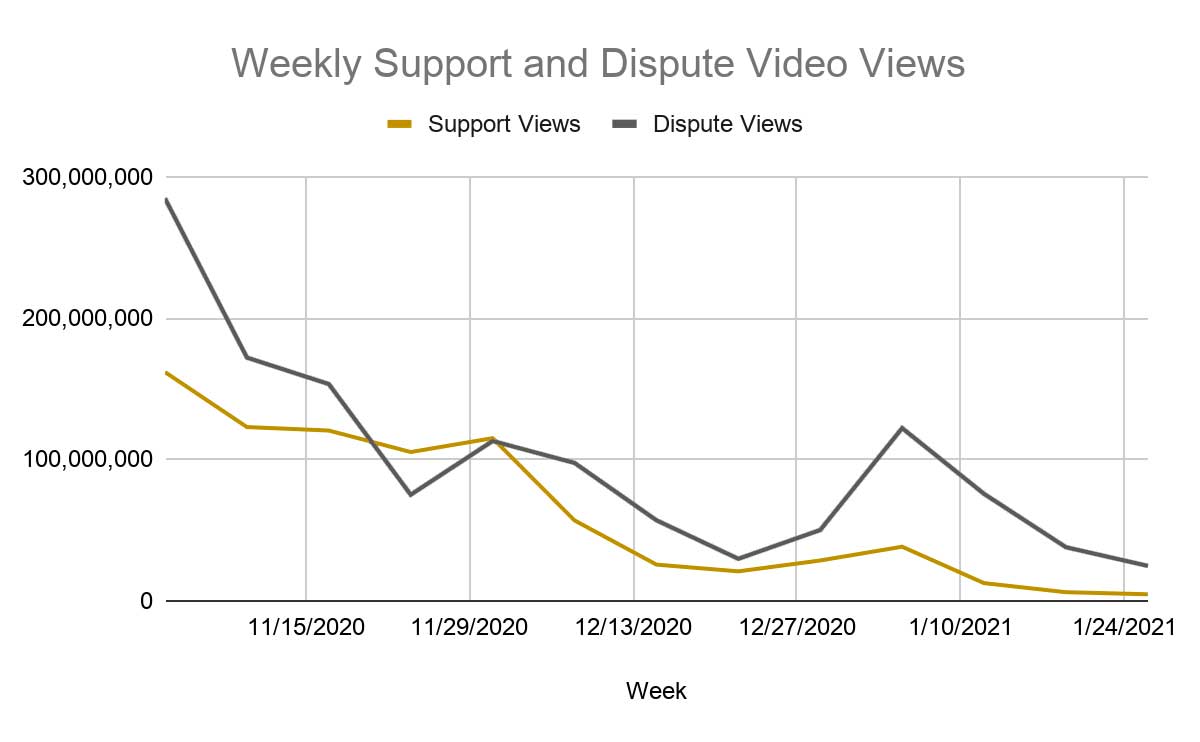
In the chart above, which contains weekly views, we can see that while videos discussing “election fraud” peaked in the two-week period following the election, they still garnered significant views well into January 2021. We believe the scale of views received by videos discussing “election fraud” during this period on YouTube indicates the platform played a significant role in shaping public sentiment.
Removed video analysis
So far, YouTube has provided very little data about videos containing “election fraud” misinformation that have been removed from their platform, and the data they have shared appears to be self-serving. In a December 9th blog post they said “Since September, we've terminated over 8000 channels and thousands of harmful and misleading elections-related videos for violating our existing policies. Over 77% of those removed videos were taken down before they had 100 views.”
These stats might seem impressive, but it’s difficult to tell whether the actions YouTube took were meaningful from them. The vast majority of channels and videos on YouTube receive a very small number of views, and if these are the videos being removed, then the impact would be negligible. The following stats would be much more informative: How many views did videos containing “election fraud” misinformation receive before being taken down? In addition, what is the estimated number of views these videos would have received if they were left on the platform?
By collecting data on videos daily, our system can detect when YouTube removes a video. While this data does not cover videos removed prior to our daily data collection, it is better than any other data provided on the topic, and we believe it is still quite informative.We found that YouTube has allowed most “election fraud” supporting content, and are slow to remove those that they have. YouTube only removes a small portion of “election fraud” narrative videos in terms of views - the removed videos had reached 96M views vs 776M views for videos that are still alive.
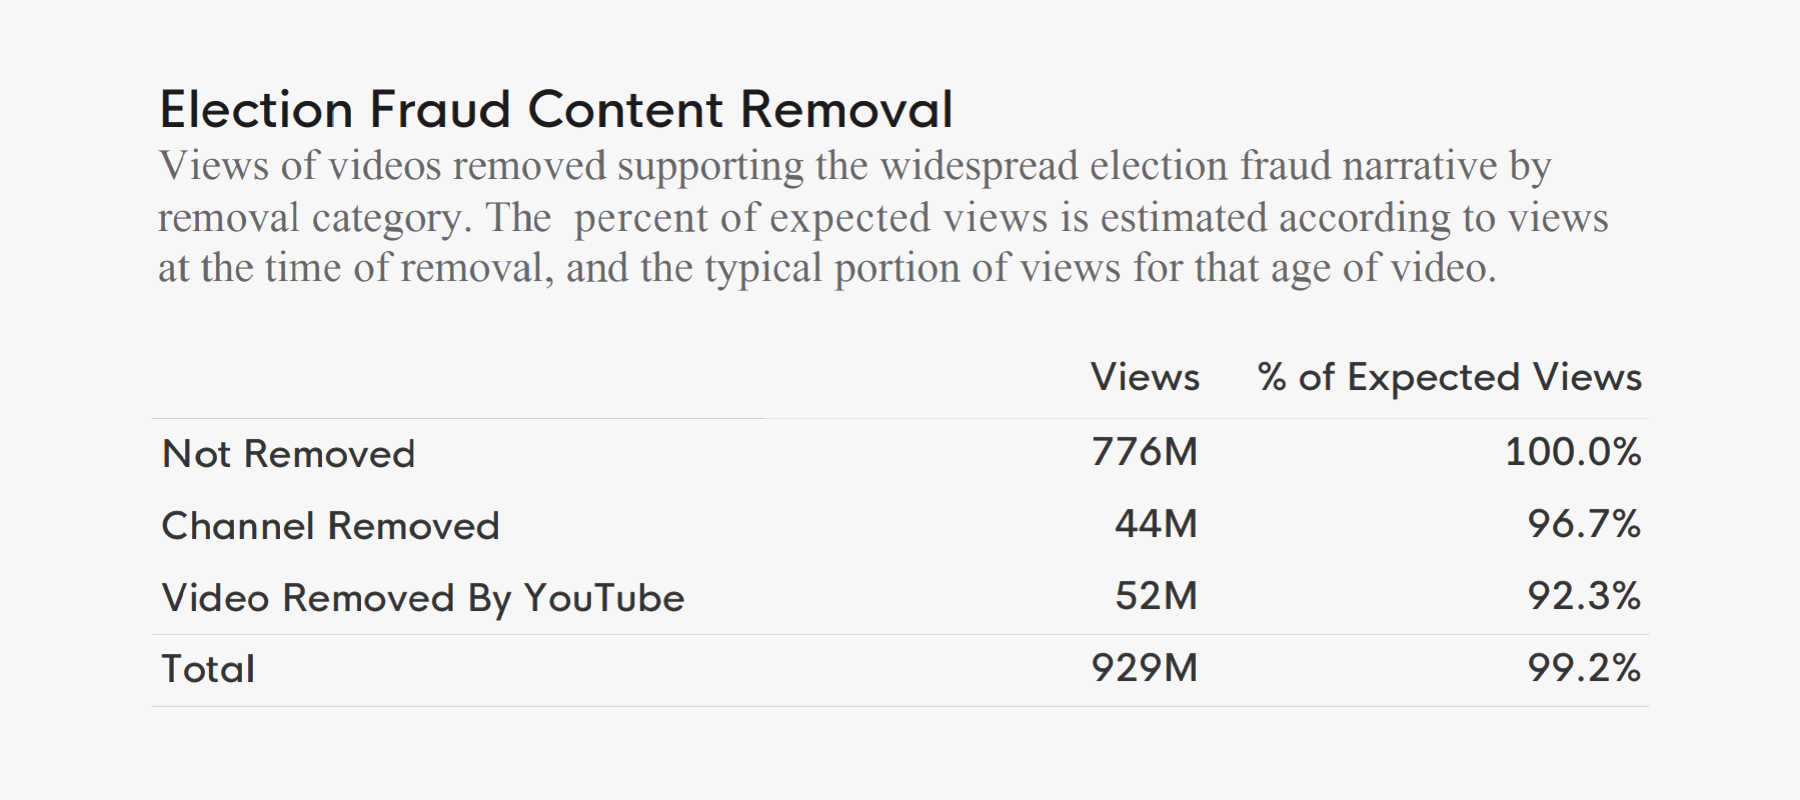
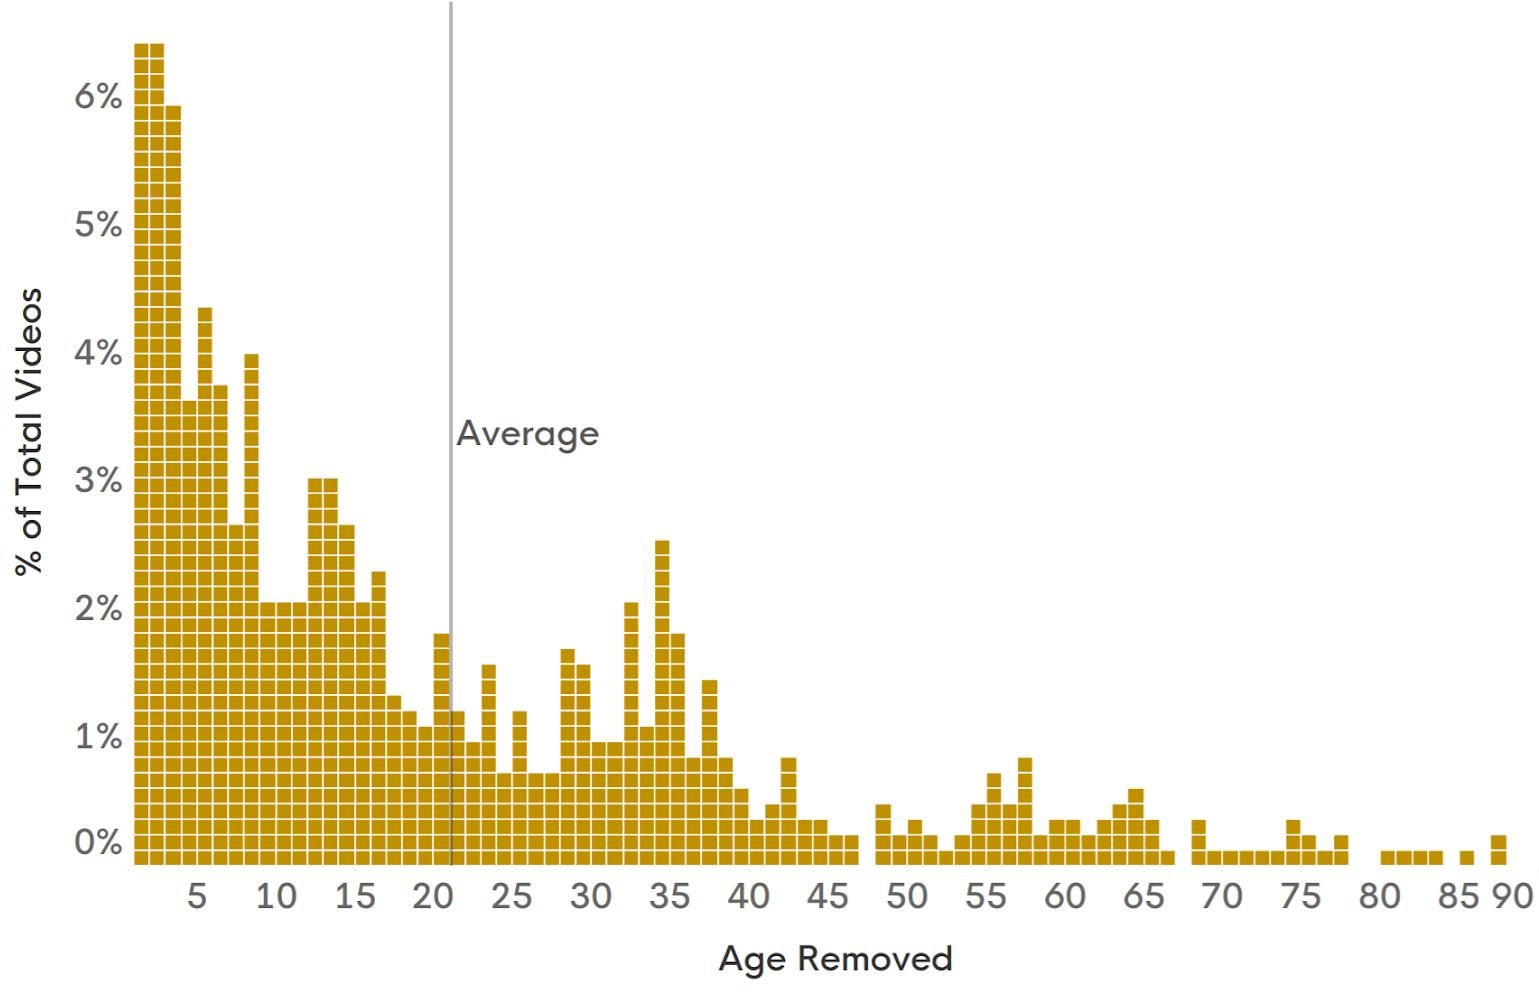
The average video removed occurs after 21 days, when about 97% of the expected views have already occurred.
Time to remove
Percent of videos removed by age (days since upload) at the time of removal. Limited to videos supporting election fraud that were removed by YouTube.
Data exploration
We find it very valuable to be able to quickly explore portions of videos where election fraud is discussed and filter videos by channel, channel type, time period, removal status, and a variety of other dimensions. We hope readers of this report will take the time to do the same. This sort of grounding in the data makes it possible to develop a much more nuanced and thoughtful understanding of the challenges presented by “election fraud” misinformation.